What does a normal October look like in St. Lucie County? The National Weather Service office in Melbourne answers that every month in the climate summaries it publishes for Fort Pierce and for Vero Beach. Each one gives the month’s normals, which are averages over 1991 to 2020, the records for that station, and what the month just ended actually did.
This page reads the October 2026 summaries, issued on Tuesday, November 3, 2026. The sources are linked at the bottom.
A normal October, in numbers
Fort Pierce
- Average high: 84.2°F
- Average low: 68.5°F
- Average temperature: 76.4°F
- Rain: 5.25 inches
- Days reaching 90°F: 1.9
Vero Beach
- Average high: 84.8°F
- Average low: 69.0°F
- Average temperature: 76.9°F
- Rain: 5.33 inches
- Days reaching 90°F: 2.0
Put plainly, a normal October here means highs in the mid 80s, nights in the upper 60s, and a little over five inches of rain. The Vero Beach summary also counts the wet days. In a normal October, 11.9 days bring at least a hundredth of an inch of rain, 3 days bring half an inch or more, and 1.5 days bring an inch or more.
The October records
Fort Pierce, with records from 1901:
- Hottest: 96°F on October 11, 1941
- Coldest: 42°F on October 21, 1989
- Wettest October: 19.31 inches, in 1924
- Driest October: 1903, listed at 0.00 inches
Vero Beach, with records from 1942:
- Hottest: 94°F, reached on October 14 and 15, 2009, and again on October 12, 2023
- Coldest: 45°F, on October 18, 1977, and again on October 30, 2012
- Wettest October: 21.93 inches, in 2011
- Driest October: 0.01 inches, in 2010
The gap between the wettest and driest years is the point worth keeping. The normal of about five inches is an average of Octobers that ran from almost nothing to around twenty inches.
How October 2026 compared
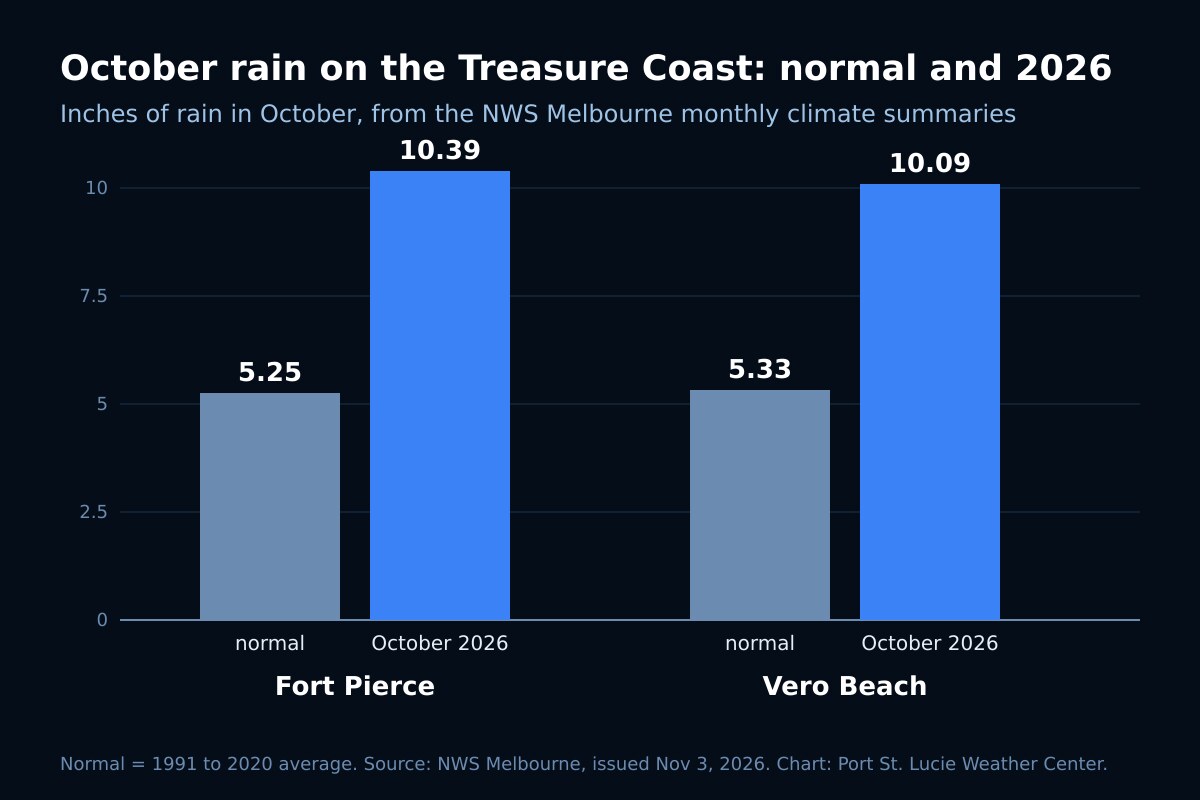
It was wet. Fort Pierce measured 10.39 inches, 5.14 inches above normal, or about twice a normal October. Vero Beach measured 10.09 inches, 4.76 above. Fort Pierce had measurable rain on 19 days. Vero Beach had it on 20 days against a normal of 11.9, and an inch or more on 6 days against a normal of 1.5. The wettest single day at Fort Pierce was October 25, with 2.85 inches. At Vero Beach the largest 24-hour total was 1.72 inches, from October 3 into October 4.
It was warm, mostly at night. The average low at Fort Pierce was 71.4°F, 2.9 degrees above normal, while the average high of 85.1°F ran only 0.9 above. Vero Beach followed the same pattern, with lows 3.2 degrees above normal. The hottest reading was 92°F at Fort Pierce on October 10, and 93°F at Vero Beach on October 10 and 11. The coolest was 62°F at both stations, on October 21 and again on October 23.
The windiest day was the first. Both stations logged their highest gust of the month on October 1: 51 mph at Fort Pierce and 48 mph at Vero Beach, each from 140 degrees, which is from the southeast.
Thunder and fog. Each station reported thunderstorms on 9 days. The Fort Pierce summary counts fog on 24 days, but only one day when it cut visibility to a quarter mile or less, the level our dense fog advisory page covers.
Against last year. October 2025 brought 6.64 inches at Fort Pierce and 11.43 inches at Vero Beach, so a wet October at Vero was nothing new. Its coolest readings were lower than this year’s: 52°F at Fort Pierce and 51°F at Vero Beach.
October and the rest of the season
October is still inside the Atlantic hurricane season, which Ready.gov gives as June 1 to November 30. If you have not checked your plan this year, our hurricane preparedness guide and the page on copying your documents and insurance are the places to start. For the year as a whole, see the Treasure Coast climate guide, and for what changes when the first fronts of the cool season arrive, our page on cold fronts.
Frequently asked questions about October weather on the Treasure Coast
Sources
- National Weather Service Melbourne, Fort Pierce climate summary for the month of October 2026, issued 1:39 pm EST, Tuesday, November 3, 2026. Normal period 1991 to 2020, record period 1901 to 2026. The link always shows the latest monthly summary.
- National Weather Service Melbourne, Vero Beach climate summary for the month of October 2026, issued 1:39 pm EST, Tuesday, November 3, 2026. Normal period 1991 to 2020, record period 1942 to 2026. The link always shows the latest monthly summary.
- Ready.gov, Hurricanes, for the season dates.
This month, as it happens
Watch the rain come in on the live radar, check the St. Lucie County alerts page for anything the Weather Service issues, or open the command center for temperature, wind and alerts in one place.